
Understanding your Airbnb occupancy rate is crucial for maximising revenue in the UK's competitive short-term rental market. The average Airbnb occupancy rate in the UK varies significantly by location, season, and property type, typically ranging from 45% to 75% annually. Whilst London properties often achieve higher occupancy rates due to consistent demand, rural retreats and coastal homes see dramatic seasonal fluctuations that can make or break annual performance.
For UK hosts, occupancy rate represents more than just a metric—it's the foundation of your pricing strategy and revenue optimisation. A property sitting empty for extended periods isn't just losing immediate income; it's missing opportunities to build reviews, establish guest loyalty, and improve search ranking visibility on Airbnb's algorithm.
What Is the Average Airbnb Occupancy Rate in the UK?
The average Airbnb occupancy rate across the UK sits between 50% and 65% annually, though this figure masks significant regional and seasonal variations that every host should understand.
London leads UK occupancy rates, with well-optimised properties achieving 65-80% annual occupancy. The capital benefits from consistent business travel, tourism, and events throughout the year. However, higher occupancy often comes with intense competition and elevated operational costs.
Manchester, Birmingham, and Edinburgh typically see occupancy rates of 55-70%, benefiting from strong business travel during weekdays and leisure tourism at weekends. These cities offer an attractive balance of demand consistency and manageable competition levels.
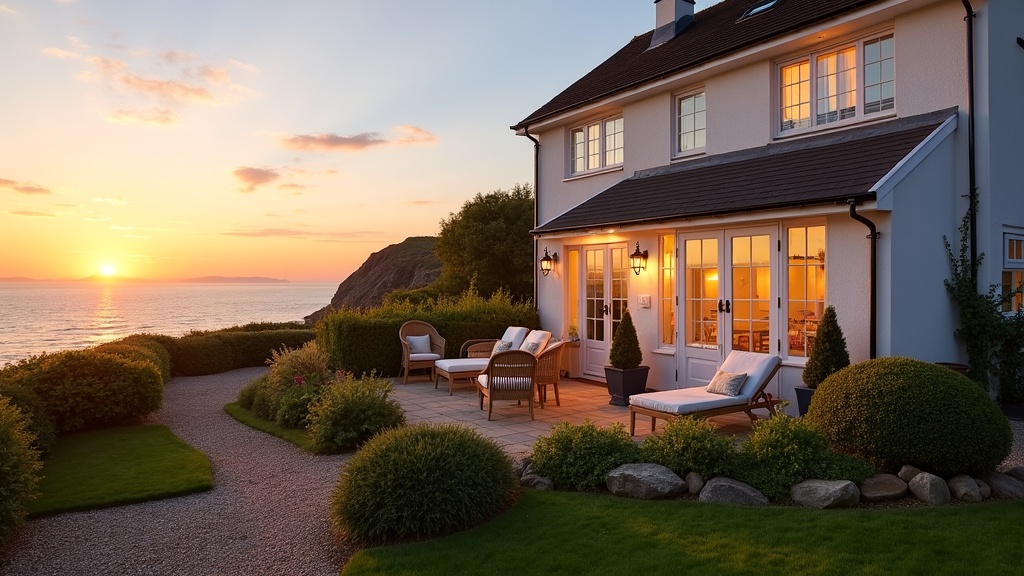
Coastal destinations like Brighton, Bath, and Cornwall properties experience the UK's most dramatic seasonal swings. Summer occupancy can reach 85-95%, whilst winter months may drop to 15-25%. Annual averages often settle around 45-60%, making peak season pricing strategy absolutely critical for annual profitability.
Rural and countryside properties face unique challenges, with occupancy rates typically ranging from 40-55% annually. Weekend demand often peaks during spring and summer, whilst midweek bookings remain sparse outside holiday periods.
How Do UK Occupancy Rates Compare Internationally?

UK Airbnb occupancy rates generally outperform many European markets, though they lag behind some high-density tourist destinations and business travel hubs.
Popular European destinations like Barcelona and Amsterdam often achieve 70-85% occupancy rates, though increasing regulatory restrictions are affecting these figures. Paris maintains strong occupancy around 65-75%, similar to London's performance levels.
US markets show significant variation, with New York and San Francisco achieving 70-80% occupancy, whilst smaller cities often struggle to reach 50-60%. The UK's relatively compact geography and established tourism infrastructure provide advantages for consistent demand.
Seasonal patterns in the UK tend to be less extreme than Mediterranean destinations, where summer occupancy can hit 95% whilst winter drops below 20%. This relative stability makes year-round hosting more viable for UK properties.
What Factors Affect Your Property's Occupancy Rate?
Multiple interconnected factors determine your property's occupancy performance, from location fundamentals you cannot change to optimisation elements entirely within your control.
Location and Accessibility
Properties within walking distance of transport links consistently achieve higher occupancy rates. Listings within 10 minutes of Underground stations in London, or main railway stations in regional cities, typically see 15-25% higher booking rates than comparable properties requiring multiple transport connections.
Proximity to attractions, business districts, universities, and entertainment areas directly correlates with occupancy performance. Properties near conference venues or corporate headquarters often maintain steady midweek demand that supports overall annual occupancy.
Pricing Strategy
Aggressive pricing can boost occupancy but devastate revenue, whilst premium pricing may optimise per-night income but leave calendars empty. The optimal balance varies by market conditions, seasonality, and local competition levels.
Dynamic pricing that adjusts for demand patterns, local events, and seasonal trends typically achieves 10-20% higher occupancy than static rates. Weekend pricing uplift strategies can capture peak demand whilst maintaining competitive weekday rates for business travellers.
Listing Optimisation
Your listing's title, photos, description, and amenities directly impact visibility and conversion rates. Properties with professional-quality photos see 40% more bookings than amateur photography, whilst detailed, benefit-focused descriptions convert browsers into bookers.
Airbnb's search algorithm favours listings with strong performance metrics, creating a virtuous cycle where optimised properties gain increased visibility, leading to more bookings and further algorithmic preference.
How Can You Calculate Your Own Occupancy Rate?
Calculating your Airbnb occupancy rate requires tracking available nights versus booked nights over a specific period, typically monthly or annually for meaningful analysis.
The basic formula is: (Booked nights ÷ Available nights) × 100 = Occupancy rate percentage
For example, if your property was available for 300 nights last year and achieved 180 bookings, your occupancy rate would be (180 ÷ 300) × 100 = 60%.
However, this calculation becomes more complex when factoring in blocked dates for maintenance, personal use, or seasonal closures. Many hosts exclude these periods from available nights to get a true market performance measurement.
Airbnb's hosting dashboard provides basic occupancy data, though it doesn't offer the granular analysis needed for strategic decision-making. Third-party tools can provide more detailed breakdowns by season, day of week, and booking lead time.
What's Considered a Good Occupancy Rate for UK Properties?
A good occupancy rate for UK Airbnb properties depends heavily on your location, property type, and business objectives, though general benchmarks can guide performance expectations.
For urban properties in major cities, achieving 65-75% annual occupancy indicates strong performance. London properties reaching 70%+ occupancy typically rank in the top quartile of local competitors.
Coastal and rural properties face different expectations due to seasonal demand patterns. Annual occupancy rates of 50-60% can be excellent for countryside retreats, particularly if peak season rates compensate for quieter winter months.
However, occupancy rate alone doesn't determine profitability. A property achieving 85% occupancy at £50 per night generates less revenue than 60% occupancy at £90 per night. Revenue per available night (RevPAN) provides a more comprehensive performance measure.
New properties typically need 3-6 months to establish consistent occupancy patterns as they build reviews, improve search rankings, and refine their market positioning. Initial occupancy rates of 30-40% can improve dramatically with optimisation and time.
How Can You Improve Your Airbnb Occupancy Rate?
Improving occupancy requires a systematic approach addressing pricing, listing optimisation, guest experience, and market positioning simultaneously.
Optimise Your Listing Foundation
Start with your listing's basic elements: title, photos, and description. Your title should immediately communicate your property's key benefits and location advantages. Photos must showcase your space's best features with professional lighting and composition.
Ensure your amenity list is complete and accurate. Missing amenities like WiFi, heating, or kitchen equipment can exclude your property from relevant searches. Even simple additions like coffee makers (a £10-20 cafetière qualifies) can improve search visibility and guest satisfaction.
Implement Dynamic Pricing
Static pricing leaves money on the table during high-demand periods whilst potentially pricing out guests during quieter times. Adjust rates based on local events, seasonal patterns, and booking lead times.
Last-minute pricing strategies can fill calendar gaps that otherwise remain empty. Offering modest discounts for bookings within 48-72 hours often generates additional revenue from price-sensitive guests.
Enhance Guest Experience
Positive reviews directly correlate with future booking rates. Focus on exceeding expectations through clear communication, seamless check-in processes, and thoughtful touches that guests remember and mention in reviews.
Quick response times to enquiries and booking requests significantly impact your listing's search ranking. Airbnb's algorithm favours hosts who respond within an hour, particularly for instant booking eligible properties.
Fill Calendar Gaps Strategically
Identify patterns in your booking gaps and develop targeted strategies. If Tuesday-Wednesday nights consistently remain empty, consider offering midweek packages or targeting business travellers with extended stay discounts.
Year-round occupancy optimisation requires different approaches for different seasons, guest types, and market conditions. What works during summer peak season may be counterproductive during winter months.
If you'd like an expert assessment of your listing with specific suggestions to improve, LetGrow's free listing score shows you exactly where you stand and identifies the biggest opportunities for occupancy improvement.
Does Higher Occupancy Always Mean Better Performance?
Higher occupancy doesn't automatically translate to better financial performance—revenue optimisation requires balancing occupancy rates with nightly pricing to maximise total income.
A property achieving 90% occupancy at budget rates may generate significantly less revenue than 60% occupancy at premium pricing. The key metric is revenue per available night, which factors in both occupancy and average daily rate.
Consider two properties: Property A achieves 80% occupancy at £60 per night, generating £43.80 per available night. Property B achieves 65% occupancy at £85 per night, generating £55.25 per available night—26% higher revenue despite lower occupancy.
Extremely high occupancy rates can also indicate underpricing. If you're consistently booked weeks in advance with minimal gaps, testing modest price increases may improve revenue without significantly impacting occupancy.
Market positioning also affects optimal occupancy targets. Luxury properties typically operate at lower occupancy rates but command premium pricing that drives superior revenue performance compared to budget alternatives.
What Role Does Seasonality Play in UK Occupancy Rates?
Seasonality dramatically affects UK Airbnb occupancy rates, with patterns varying significantly between property types and geographic locations.
Summer months (June-August) represent peak season for most UK properties, with occupancy rates typically increasing 20-40% compared to winter periods. School holidays, improved weather, and increased tourism drive this seasonal surge.
City properties often experience more stable year-round demand due to business travel and urban attractions that operate regardless of weather. However, even London properties see reduced midweek occupancy during August as business travel decreases.
Coastal properties face extreme seasonal variations, with some achieving 95% summer occupancy dropping to 15% in winter months. Successful coastal hosts often focus intensively on maximising revenue during peak months rather than pursuing year-round operations.
Christmas and New Year periods can provide unexpected opportunities for rural and countryside properties as families seek retreat destinations for celebrations and extended holidays.
Understanding your local seasonal patterns enables strategic calendar management, maintenance scheduling, and pricing optimisation that maximises annual performance rather than just peak season results.
How Does Competition Affect Your Occupancy Rate?
Local competition density and quality directly impact your property's occupancy potential, making competitor analysis essential for realistic goal setting and strategic planning.
Markets with high-quality competition require superior differentiation to achieve strong occupancy rates. Simply matching competitor offerings often results in price-based competition that erodes profitability for all participants.
New supply entering your market typically reduces occupancy rates across existing properties, particularly if new listings offer similar positioning at competitive rates. Monitoring competitor openings helps anticipate and prepare for demand distribution changes.
However, increased competition can also signal market growth and rising demand that benefits all quality operators. Tourist destinations often see rising demand that outpaces new supply, creating opportunities for all well-positioned properties.
Competitor pricing strategies significantly influence your optimal rate positioning. Markets where competitors use dynamic pricing require more sophisticated rate management than areas with mostly static pricing approaches.
Not sure how you compare? Get your free Airbnb performance score and see how your listing stacks up against local competitors in terms of occupancy potential and market positioning.
What Tools Can Help Track and Improve Occupancy?
Various tools and platforms can help UK hosts monitor occupancy performance, analyse market trends, and identify improvement opportunities.
Airbnb's native analytics provide basic occupancy data, though they lack the granular analysis needed for strategic optimisation. The platform shows booking patterns, guest origins, and seasonal trends at a high level.
Third-party revenue management tools offer more sophisticated analysis, including competitor benchmarking, demand forecasting, and automated pricing adjustments based on market conditions.
Manual tracking through spreadsheets remains valuable for hosts wanting detailed control over their data analysis. Recording daily rates, booking sources, guest demographics, and local events can reveal patterns that automated tools might miss.
Market intelligence platforms provide competitor analysis, showing how your occupancy compares to similar properties and identifying pricing gaps or opportunities for differentiation.
The key is selecting tools that match your operational complexity and growth objectives whilst providing actionable insights rather than overwhelming data volumes.
Want a professional eye on your listing? LetGrow analyses your title, photos, pricing, and amenities for free—no obligation, just actionable insights that can improve your occupancy rate and overall performance.
Common Occupancy Rate Mistakes to Avoid
Several common mistakes can severely impact occupancy rates, often stemming from misunderstanding guest expectations or market dynamics.
Overpricing during low-demand periods is perhaps the most frequent error. Maintaining peak season rates during winter months often results in extended vacancy periods that devastate annual revenue performance.
Neglecting listing maintenance and updates causes gradual decline in booking conversion rates. Photos that looked professional two years ago may now appear dated compared to newer competitor listings with contemporary styling and photography.
Ignoring guest feedback and review patterns often indicates systemic issues affecting rebooking likelihood and word-of-mouth referrals. Addressing recurring complaints quickly prevents them from becoming entrenched reputation problems.
Inconsistent availability calendar management confuses potential guests and may trigger algorithmic penalties. Regular calendar updates ensure accurate availability information and prevent disappointed guests from negative reviews.
Finally, focusing exclusively on occupancy rate without considering revenue per available night can lead to a race-to-the-bottom pricing strategy that generates activity but destroys profitability.
Understanding and optimising your Airbnb occupancy rate requires balancing multiple factors whilst maintaining focus on overall revenue performance. Success comes from consistent attention to listing quality, strategic pricing, and guest experience rather than chasing occupancy metrics alone. Ready to see how your listing measures up? Get your free score at LetGrow and discover specific opportunities to improve your occupancy rate and revenue potential.